Measurements
/General
Time Domain vs. Frequency Domain Measurements
Explore the differences between time and frequency domain signal analysis, the parameters measured, and instruments used in each method.
2 min read
Advertisement
Table of Contents
This document provides a glossary of terms related to Vector Signal Generators (VSG) and Vector Signal Analyzers (VSA). It covers key concepts such as power vs. time, phase vs. time, IQ vs. time, EVM, spectral flatness, gain response, and CCDF.
The power versus time plot displays the instantaneous power of a complex OFDM signal, sample by sample. The amplitude of the signal is derived in dBm and plotted. This is analogous to a time domain plot seen on an oscilloscope.
The power in dBm is calculated using the following formula:
Power in dBm = 10 * log { ( I² + Q² )/1mW }
Similar to the power vs. time plot, the phase vs. time plot displays the phase value for each IQ pair over time. The phase value of an IQ sample is calculated as follows:
Phase in degrees = tan⁻¹(Q/I) * (180/π)
IQ vs. time plots show the I (in-phase) and Q (quadrature) amplitudes separately over time. This measurement displays the raw I and raw Q output from the down converter. It’s useful for analyzing any imbalance between the I and Q components.
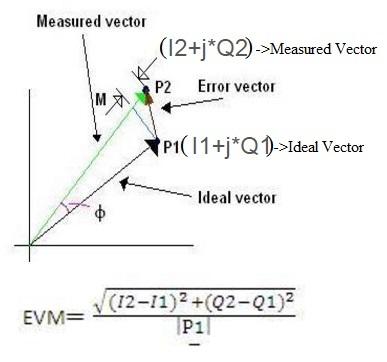
EVM, or Error Vector Magnitude, is a measure of a modem’s performance when subjected to impairments, both at baseband and RF. When a modulated signal experiences these impairments, the constellation diagram changes. The impaired IQ data needs correction at the receiver using front-end algorithms to minimize bit errors in the decoded data.
EVM is calculated based on the difference between the measured IQ value and the ideal (referenced) IQ value. |P1| represents the absolute magnitude of the ideal IQ vector.
CCDF helps analyze peak-to-average power ratios of baseband IQ data over time. It’s essential for proper power amplifier design, taking into account non-linear regions and saturation requirements. CCDF plots the percentage of time the IQ power is above a certain average value.
Spectral flatness (or gain flatness) measures the consistency of the amplitude or magnitude response of time domain samples. It assesses the difference between amplitudes of consecutive samples in the time domain, or between frequency points in the frequency domain. This is key for assessing the fidelity of signal generation or analysis over a bandwidth.
Advertisement
Measurements
/General
Explore the differences between time and frequency domain signal analysis, the parameters measured, and instruments used in each method.
Measurements
/Signal-Analysis
Explore EVM measurements for signal quality, focusing on subcarrier and symbol analysis in OFDM systems. Understand how each approach helps identify impairments.
Terminology
/General
A glossary of common terms used with network analyzers, including transmission coefficient, insertion loss, gain, reflection coefficient, return loss, and S-parameters.