Time Domain vs. Frequency Domain Measurements
Advertisement
This article explores the fundamental differences between time domain and frequency domain measurements, two essential methods for analyzing real-world signals. We’ll delve into how these methods work, the parameters they measure, and the instruments used in each approach.
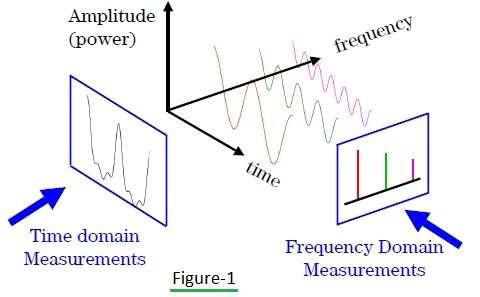
Any real-world signal is essentially a combination of various sine waves, each with its own amplitude, frequency, and phase. We can analyze these signals in two primary ways: the time domain and the frequency domain. While some signal characteristics, like frequency and phase, are challenging to examine directly in the time domain, they become much clearer when viewed in the frequency domain.

Figure 1: Illustrates the relationship between time, amplitude, and frequency in signal representation.
As shown in Figure 1, a complex waveform can be deconstructed into a sum of simpler sine waves. Mathematical tools like the Fourier Transform, specifically the Inverse Fast Fourier Transform (IFFT) and Fast Fourier Transform (FFT), allow us to seamlessly convert between time-domain and frequency-domain representations of a signal.
Time Domain Measurements

Figure 2: A typical setup for time domain measurements using an Oscilloscope.
In time domain measurements, we observe how a signal’s amplitude changes over time. The primary instrument used for these measurements is an Oscilloscope, which plots time on the X-axis and the signal’s amplitude on the Y-axis. Figure 2 shows a typical time domain measurement setup.
Here are some key parameters measured in the time domain:
- Instantaneous Power Spectrum: This shows the power of a signal at different points in time. The X-axis represents time samples, and the Y-axis shows the corresponding power levels.
- Complementary Cumulative Distribution Function (CCDF): CCDF is particularly useful for analyzing Peak-to-Average Power Ratio (PAPR). It reveals how often a signal’s power exceeds a specific threshold.
- Eye Diagram: This display visualizes the quality of a digital signal by plotting real and imaginary components against time. It’s commonly used in communications for assessing signal integrity and identifying impairments.
Frequency Domain Measurements

Figure 3: A typical setup for frequency domain measurements using an RF Spectrum Analyzer.
Frequency domain measurements focus on analyzing the signal’s frequency content. The primary instrument for this is an RF Spectrum Analyzer, which plots frequency on the X-axis and the signal’s amplitude or power on the Y-axis. Figure 3 illustrates a typical frequency domain measurement setup.
Here are some key parameters measured in the frequency domain:
- Power Spectrum: This shows the distribution of a signal’s power across different frequencies. The X-axis displays frequency, and the Y-axis represents the power spectral density.
- Channel Frequency Response: This parameter measures how a channel (e.g., a filter or a communication channel) affects different frequencies within a signal.
- Error Vector Magnitude (EVM): EVM is a measure of the quality of a modulated signal. It quantifies the difference between the ideal transmitted signal and the actual received signal.
- I/Q Constellation Diagram: Used in digital communication, this diagram visually represents the different possible states of a modulated signal, showing the in-phase (I) and quadrature (Q) components.
Conclusion
In essence, time domain measurements provide a snapshot of how a signal’s amplitude changes with time, while frequency domain measurements reveal the signal’s frequency content and distribution. Both types of measurements are vital for a complete understanding of signal behavior, and each provides unique insights that are crucial in various applications. By combining these approaches, engineers and scientists can fully characterize and optimize the performance of electronic systems.
Advertisement
 T&M
T&M 


