Articles
/General
Advantages and Disadvantages of Spectrum Analyzers
Explore the benefits and drawbacks of spectrum analyzers, essential tools for frequency domain analysis, including swept, FFT, and real-time models.
3 min read
Advertisement
Table of Contents
This article provides a breakdown of common spectrum analyzer terminologies. Understanding these terms is crucial for accurately using and interpreting data from these powerful test and measurement instruments.
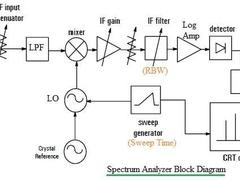
A spectrum analyzer, as illustrated in the block diagram below, takes an incoming RF signal and converts it down to a lower intermediate frequency (IF). This IF signal then passes through amplification and filtering stages before being detected. The detected signal is further processed with a video filter before being displayed. The horizontal axis, which represents the frequency, is determined by the set span and the sweep time.
Here are some essential spectrum analyzer terms explained in detail:
The Resolution Bandwidth (RBW) is a configurable setting, usually found on the front panel of a spectrum analyzer. It corresponds to the bandwidth of the IF filter, a band-pass filter that acts as a window for signal detection.
The Video Bandwidth (VBW) is another adjustable setting on the spectrum analyzer. It relates to the bandwidth of the video filter, located after the diode detector.
The Span setting dictates the frequency range that will be displayed on the horizontal axis. It’s determined in conjunction with the RF center frequency.
The Reference Level is related to the IF gain and attenuator stages of the analyzer, specifically after the RF mixer. It helps the analyzer correctly measure a DUT (Device Under Test) within a suitable dynamic range.
Advertisement
Articles
/General
Explore the benefits and drawbacks of spectrum analyzers, essential tools for frequency domain analysis, including swept, FFT, and real-time models.
Terminology
/General
A breakdown of common decibel units used in RF and signal processing: dB, dBc, dBd, dBi, dBm, and dBW.
Measurements
/General
Learn about frequency measurement, including units like Hertz, and the equipment used such as oscilloscopes and spectrum analyzers.