This article breaks down the key differences between T-tests, F-tests, and Z-tests, all of which are crucial tools in statistical hypothesis testing. We’ll cover when to use each test and what they tell us about our data.
What is a Hypothesis?
Before diving into the tests, let’s define what a hypothesis is in the scientific context:
- It’s a prediction or statement that can be tested through scientific methods.
- It’s a proposition that can be either proven or disproven using various scientific techniques.
- It establishes a relationship between an independent variable (what you manipulate) and a dependent variable (what you measure).
- All three tests (T, F, and Z) are types of hypothesis tests.
- The entire decision to either accept or reject the null hypothesis hinges on these tests, so choosing the right one is crucial.
T-test
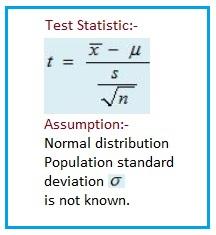
- Type: Univariate hypothesis test.
- When to Use:
- When the population standard deviation is unknown.
- When dealing with a small sample size (n < 30).
- To compare the means of two populations.
- Key Points:
- The T-test is generally more commonly used compared to the Z-test, especially when you don’t know the population standard deviation.
- While the image shows a one-sample T-test, other variations like two-sample T-tests and paired T-tests exist for different scenarios.
F-test
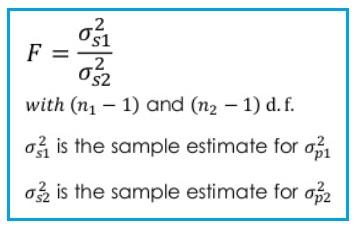
- Type: Statistical test.
- When to Use:
- To determine if the variances of two normally distributed populations are equal.
- To compare two population variances.
- As part of a one-way ANOVA test (to test for differences in means across three or more populations).
- Key Points:
- The test relies on the Snedecor F-distribution under the null hypothesis.
- The F-test can be used to compare the differences between three or more population means using ANOVA.
Z-test
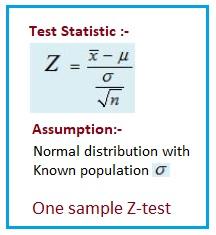
- Type: Statistical hypothesis test that follows a normal distribution.
- When to Use:
- With moderate to large samples (n > 30).
- When you want to determine if the means of two populations are different, and you know their variances, and you have a large sample size.
- Key Points:
- Z-tests depend on certain conditions to be reliable, making them less adaptable than T-tests.
- The Z-test is preferred over the T-test when the population standard deviation values are known.
- The image shows the test statistic for a one-sample Z-test.
Key Differences Summarized
The table below highlights the core differences between these three parametric tests:
| Features | F-test | T-test | Z-test |
|---|
| Application | Comparing variances of two samples | Comparing the mean to a value, or the means of two samples | Same as T-test but for large samples |
| Used When | 3 or more μs | n < 30 and σ is unknown | n >= 30 and σ is known |
In short, choose the appropriate test based on your data and what you need to compare.
Conclusion:
T-tests, F-tests, and Z-tests are fundamental statistical methods used for different types of hypothesis testing:
- T-test: Used when comparing the means of one or two small sample groups (typically <30) to determine statistical significance. Example: Testing average student performance in two different classes.
- F-test: Used to compare variances between two datasets, often in ANOVA (Analysis of Variance) to check if multiple sample groups differ significantly. Example: Testing whether different fertilizers affect crop yield.
- Z-test: Applied when sample sizes are large (>30) and population variance is known, used for proportion and mean comparisons. Example: Comparing the average height of students in different universities.
Choosing the correct test depends on sample size, variance conditions, and whether you are comparing means or variances. Misapplying these tests can lead to incorrect conclusions in statistical analysis.